- Executive Resilience Insider
- Posts
- The Infrastructure Resilience Delusion
The Infrastructure Resilience Delusion
5 Risk Frameworks That Transform Deployment Velocity Theater Into Market Dominance
Mario Peshev
October 28, 2025
Technology infrastructure investment reaches record levels while competitive intelligence reveals a brutal paradox: resilience-engineered organizations systematically capture market positioning from velocity-optimized competitors through calculated infrastructure discipline rather than deployment theater. After analyzing breach impact across Fortune 500 companies and tracking downtime costs reaching $23,750 per minute for large enterprises, organizations building resilience architecture capture competitive advantages while velocity-focused companies struggle with customer churn rates four times higher than reliability-engineered competitors.
Cross-sector analysis reveals strategic miscalculation:
Organizations optimizing deployment velocity while resilience-focused competitors capture positioning through sustained uptime
Executive teams perfecting feature sophistication while infrastructure-disciplined businesses establish market leadership through reliability guarantees
Technology leaders consuming capital on innovation theater while operationally-sound competitors generate positioning independent of $10.22 million breach recovery costs
The Infrastructure Sustainability Paradox:
Infrastructure investment ↑ = System resilience ↓
Deployment velocity ↑ = Operational reliability ↓
Feature sophistication ↑ = Market positioning ↓
Calculated resilience frameworks generate competitive multipliers faster than deployment theater creates market positioning.
Organizations have 90 days to build comprehensive resilience architecture or surrender advantages to infrastructure-focused competitors who understand market dynamics that velocity approaches cannot overcome.
Why velocity-driven infrastructure destroys competitive positioning
Fortune 500 breach patterns exemplify failure across sectors. One organization required $60 million in breach recovery costs alongside establishing an entirely new CISO position and rebuilding infrastructure architecture from foundation principles.
IBM's 2025 breach analysis validates this contrarian reality: organizations experience average recovery costs of $10.22 million in the United States. 63% of breached companies still recovering beyond 100 days after incidents occur. Healthcare sector averages reach $7.42 million per breach for the 14th consecutive year as industry leader.
Infrastructure evolution demonstrates the difference between deployment sophistication and resilience orchestration:
Phase 1: Velocity-driven development producing feature sophistication without operational sustainability Phase 2: Breach incident requiring complete infrastructure rebuild Phase 3: Resilience allocation through calculated risk methodology
Market positioning emerges through infrastructure orchestration. Deployment validation cannot replicate this advantage.
The competitive gap that velocity optimization cannot bridge
Gartner research demonstrates systematic customer behavior patterns. Following service outages, customers prove four times more likely to switch providers than after product functionality issues. Deployment velocity creates feature sophistication. It systematically destroys the reliability foundation that customer retention actually requires.
Downtime costs reveal infrastructure reality that velocity approaches systematically ignore. Large enterprises experience average costs of $23,750 per minute during system failures—$1.425 million per hour of operational disruption. 44% of organizations report downtime costs exceeding $1 million hourly. 33% of enterprises experiencing losses between $1-5 million per hour during critical system failures.
This resilience methodology eliminates velocity dependency. It builds competitive advantages through infrastructure understanding that deployment sophistication cannot generate alone.
The Competitive Infrastructure Formula:
Resilience discipline + Sustained operations + Market reliability = Strategic positioning advantages
The infrastructure methodology that competitive leaders discovered
Market leaders achieving breakthrough positioning operate through fundamentally different infrastructure philosophies. They separate operational intelligence from deployment requirements by building comprehensive resilience evaluation frameworks that reveal competitive opportunities unavailable through velocity approaches.
Brennan P. Baybeck, Senior Vice President and CISO at Oracle, demonstrates infrastructure intelligence that velocity approaches miss: "We want to utilize as many of those native capabilities as possible as it reduces costs, simplifies security infrastructure, and cuts overhead."
Baybeck's methodology eliminates deployment dependency. It builds market advantages through infrastructure intelligence functioning regardless of feature cycles or innovation requirements.
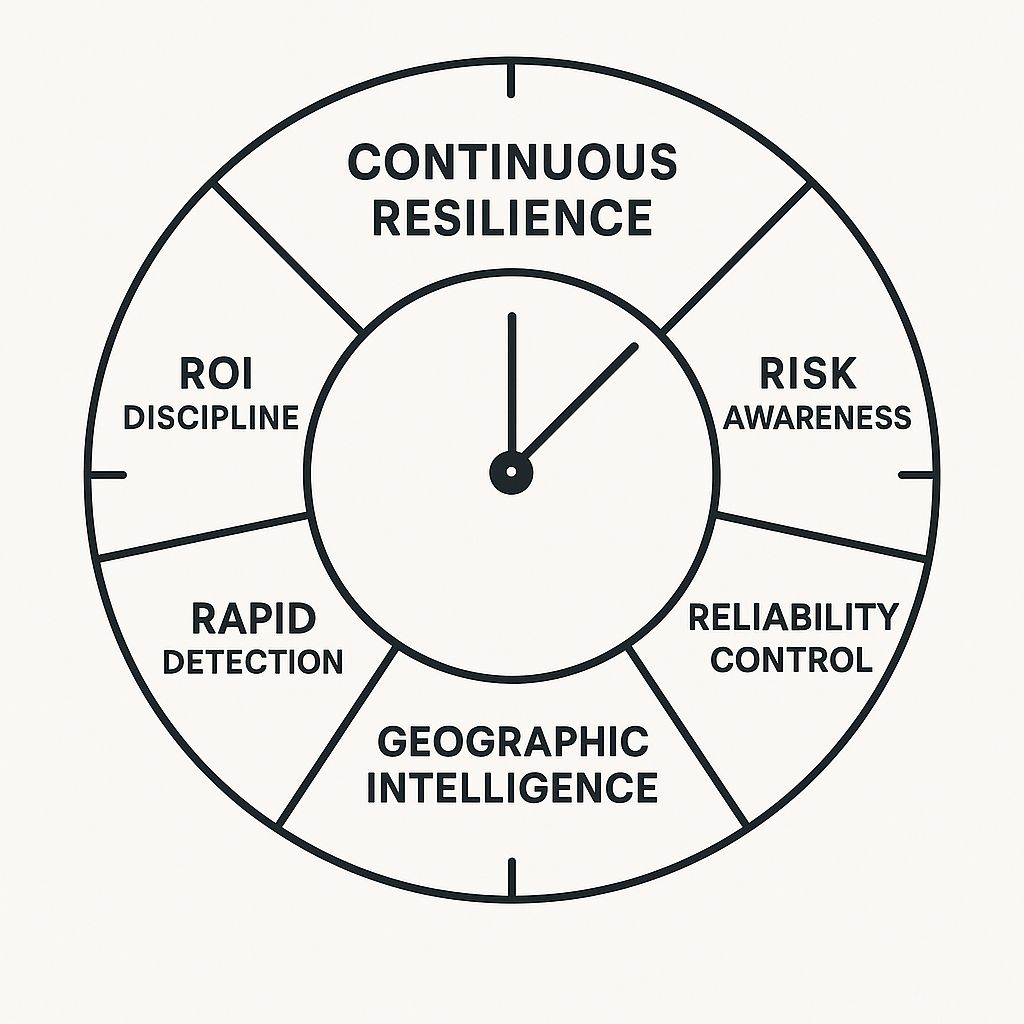
5 frameworks that transform deployment theater into resilience intelligence engines
Framework 1: The ROI Calculation Engine
From Deployment Procurement to Strategic Intelligence
Investment Quantification Protocol
Establish infrastructure decisions through comprehensive return analysis. Organizations validate strategic positioning through ROI alignment.
Incident response team implementation generates measurable advantages: organizations deploying IR capabilities save $248,000 annually. Identity and access management solutions produce $223,000 in annual cost avoidance.
Implementation: Allocate 60 minutes weekly for infrastructure ROI evaluation. Schedule sessions Tuesday mornings. Create shared spreadsheet tracking: initiative name, start date, resources consumed, projected ROI, actual ROI quarter-to-date.
Structure sessions: First 20 minutes, update ROI numbers. Next 30 minutes, evaluate initiatives using red/yellow/green scoring: (1) ROI positive within 12 months, (2) cost avoidance measurable, (3) resources justified. Final 10 minutes, make kill decisions on red-scored initiatives.
Track cumulative savings. Document quarterly ROI trends. Eliminate initiatives without returns within 90-day cycles.
Automation Integration
IBM breach analysis demonstrates organizations using AI and automation in security operations save $1.9 million. The breach lifecycle reduces by 80 days.
Implementation: Deploy SIEM solutions aggregating security logs. Configure automated alerting triggering immediate response when anomalies detected.
Implement automated patch management applying updates during maintenance windows. Deploy configuration management tools ensuring compliance. Establish automated backup verification testing recovery procedures weekly.
Framework 2: The Cost-of-Inaction Assessment Protocol
From Velocity Optimization to Risk Intelligence
Impact Calculation Strategy
Halliburton's August 2024 ransomware breach cost $35 million in operational recovery. MGM Resorts International paid $45 million settling class action lawsuits following 2023 ransomware attacks. CDK Global's automotive SaaS breach disrupted 15,000 dealer locations across North America.
"The cost of inaction can put you in jail. Period. Doesn't matter why it's not working, you're driving faster than allowed," explains infrastructure reality where deployment velocity without resilience assessment creates irreversible competitive damage.
Risk intelligence creates competitive advantages through reliable evaluation. Traditional velocity attempts innovation through deployment processes lacking strategic credibility.
Organizations discover infrastructure paralysis occurs when executives optimize for velocity without quantifying downtime through systematic assessment. Rather than pursuing deployment speed, effective leaders establish risk intelligence through predictable measurement.
Severity Analysis Implementation
Focus on systematic impact measurement. Infrastructure leaders implement probability-weighted assessments shifting focus from feature deployment to operational sustainability.
Create risk matrices evaluating each vulnerability across two dimensions: likelihood of exploitation (scored 1-5 where 1=rare, 5=almost certain) and business impact if exploited (scored $100K to $50M+ based on downtime costs, breach recovery, regulatory penalties, customer churn).
Implementation: Conduct quarterly cost-of-inaction assessments calculating potential breach recovery expenses, regulatory penalties, and customer churn costs. Schedule full-day sessions in January, April, July, October with CIO, CISO, CFO, and business unit leaders.
Document downtime impact at $23,750 per minute for large operations—translating to $1.425 million per hour. Calculate organization-specific costs by multiplying average hourly revenue by productivity loss percentage during outages.
Prioritize resilience investments against quantified inaction risks. Create probability matrices scoring likelihood multiplied by impact for each identified vulnerability. Rank all initiatives by risk score. Fund highest-scoring vulnerabilities first until budget exhausted.
Map regulatory exposure across jurisdictions: GDPR fines up to 4% annual revenue, HIPAA penalties reaching $1.5M per violation category, PCI-DSS fines plus card brand assessments. Calculate maximum regulatory exposure by summing potential penalties.
Track cost-of-inaction metrics quarterly showing how resilience investments reduce aggregate risk scores. Demonstrate ROI through prevented incidents versus predicted probability without investment.
Framework 3: The Detection Velocity Accelerator
From Security Obstacle to Competitive Positioning
Response Intelligence Strategy
IBM analysis demonstrates average breach identification and containment requires 241 days—representing nine-year improvement in detection capabilities. Organizations implementing comprehensive monitoring architectures identify threats systematically faster than competitors optimizing deployment velocity.
Mean time to detect (MTDD) becomes critical differentiator. Organizations targeting sub-15-minute detection windows for critical vulnerabilities establish infrastructure advantages that deployment sophistication cannot achieve.
Detection intelligence creates strategic advantages through response velocity. The 241-day average represents competitive vulnerability—organizations maintaining month-long detection windows surrender market positioning to competitors achieving hour-long identification cycles.
Breach cost analysis validates detection urgency: organizations containing breaches within 200 days experience average costs of $3.93 million. Breaches exceeding 200 days average $4.95 million—demonstrating $1 million cost penalty for detection delays.
Monitoring Implementation
Design detection architecture around competitive impact. Deploy Security Information and Event Management (SIEM) platforms aggregating logs from firewalls, servers, endpoints, applications, and cloud services into centralized dashboards. Configure correlation rules identifying attack patterns across distributed systems.
Implementation: Establish 24/7 Security Operations Center (SOC) monitoring infrastructure with automated alerting for critical vulnerabilities. Target sub-15-minute MTDD for high-severity threats through automated detection systems triggering immediate escalation protocols.
Staff SOC with three 8-hour shifts ensuring continuous coverage. Each shift requires minimum two analysts monitoring dashboards plus one senior analyst available for escalation.
Document detection improvement through quarterly breach simulation exercises measuring identification and containment velocity. Conduct tabletop exercises testing incident response protocols.
Deploy endpoint detection and response (EDR) platforms on all devices providing real-time visibility into system activities. Configure automated playbooks triggering immediate response protocols when thresholds breach: isolate compromised systems, capture forensic evidence, initiate incident response.
Establish detection baselines measuring current MTDD across vulnerability categories. Set quarterly improvement targets: critical vulnerabilities from 60 minutes to 15 minutes, high-severity from 4 hours to 1 hour.
Integrate threat intelligence feeds providing real-time information about emerging attack patterns. Correlate internal monitoring data against external threat indicators identifying potential compromises before full exploitation occurs.
Framework 4: The Reliability Differentiation Accelerator
From Feature Optimization to Market Capture
Reliability Intelligence Protocol
Market analysis demonstrates customer switching behavior following infrastructure failures. Organizations maintaining "five nines" reliability (99.999% uptime—5.26 minutes downtime yearly) establish market positioning through operational excellence. Velocity competitors experience four times higher customer churn.
AWS demonstrates positioning advantages through comprehensive uptime tracking. Cloud infrastructure providers compete primarily on reliability guarantees.
"Even with perfect 99% uptime, customers must still expect 8 hours of frustration per year," explains why infrastructure discipline separates market leaders.
Calculate business mathematics: 99% uptime = 87.6 hours annual downtime. At $1.425 million per hour for large enterprises, improving to 99.9% uptime generates $112.35 million in competitive advantage.
Market Capture Implementation
Establish tiered reliability targets: customer-facing systems require 99.99% uptime (52.56 minutes annual downtime), internal operations accept 99.9% uptime (8.76 hours annual downtime).
Implementation: Track system uptime through comprehensive monitoring dashboards. Implement distributed monitoring from multiple geographic locations.
Establish public SLA commitments with financial penalties. Structure SLAs with graduated credits: 99.95-99.99% uptime = 10% service credit, 99.9-99.95% = 25% credit, below 99.9% = 100% credit.
Document reliability improvements through monthly availability reports. Publish uptime percentages, incident counts, mean time to recovery, and root cause analysis for outages exceeding SLA thresholds.
Implement chaos engineering practices deliberately introducing failures testing resilience mechanisms. Schedule monthly chaos experiments: random server terminations, network latency injection, dependency failures.
Create public status pages showing real-time system health and historical uptime data.
Framework 5: The Geographic Calibration System
From Universal Standards to Market Intelligence
Geographic Intelligence Development
European robotics manufacturers demonstrate strategic advantage through selective reliability utilization combined with calculated geographic assessment. Error tolerance varies dramatically across markets: Japanese operations maintain near-zero tolerance for system failures. United States and European markets accept 1-2.5% operational variance in specific applications.
Strategic infrastructure problems require geographic calibration combined with regulatory intelligence. Japanese manufacturing culture emphasizes perfection—single defect rates measured in parts per million. United States markets tolerate higher error rates prioritizing speed-to-market.
Market Adaptation Implementation
Toyota, Honda, and Subaru consistently rank highest in reliability charts through geographic quality disciplines. European GDPR enforcement creates compliance frameworks requiring infrastructure discipline with potential fines reaching 4% of annual revenue for systematic failures.
Regulatory complexity varies across jurisdictions. GDPR imposes strict data residency rules. California's CCPA establishes different consumer privacy frameworks. China's data security law mandates local storage for citizen data.
Implementation: Conduct geographic risk assessments identifying regulatory requirements and cultural tolerance levels across operational markets. Schedule quarterly geographic audits evaluating compliance posture across all jurisdictions where systems operate or data resides.
Map each market's regulatory landscape: GDPR in European Union (breach notification within 72 hours, penalties up to €20 million or 4% global annual revenue), CCPA in California ($7,500 per intentional violation), PIPEDA in Canada (mandatory breach reporting), LGPD in Brazil (data protection requirements mirroring GDPR structure).
Allocate infrastructure resources proportionally to regional compliance demands weighted by revenue exposure and penalty severity. High-revenue markets with severe penalties receive disproportionate investment ensuring compliance infrastructure prevents business-threatening fines.
Assign dedicated compliance resources per region based on risk exposure. Large markets with complex regulations require full-time compliance specialists. Smaller markets share regional compliance managers covering multiple jurisdictions.
Establish data residency architectures meeting local storage requirements. Deploy regional infrastructure nodes in EU, Asia-Pacific, North America enabling data localization while maintaining centralized management visibility.
Implement geographic failover strategies ensuring regulatory compliance during disaster scenarios. EU customer data failing over to US systems potentially violates GDPR—requiring EU-to-EU failover architecture despite higher infrastructure costs.
Infrastructure resilience transforms deployment theater
The infrastructure gap widens daily. Every breach costing $10.22 million, every outage driving 4x customer churn, every competitor maintaining five nines uptime demonstrates what velocity optimization systematically ignores: resilience determines market positioning.
Deployment sophistication cannot bridge this gap. Feature velocity cannot recover customer trust destroyed by downtime. Innovation theater cannot survive breach recovery costs consuming operational budgets.
Organizations building comprehensive resilience systems capture positioning advantages during the exact moments velocity-focused competitors experience systematic failures. The 241-day average breach detection window. The $23,750 per minute downtime cost. The regulatory penalties reaching 4% of revenue. These aren't abstract risks—they're competitive realities separating market leaders from failed deployment approaches.
Companies implementing these frameworks within the next 90 days establish operational advantages that deployment-dependent executives cannot replicate through feature sophistication alone.
Infrastructure failures are irreversible. Velocity competitors won't wait. Your systems either withstand pressure or surrender market position.